Scaling to 1000 clusters - Part 3
In part 1, we introduced the Bare Metal Operator test mode and saw how it can be used to play with BareMetalHosts without Ironic and without any actual hosts. We continued in part 2 with how to fake workload clusters enough for convincing Cluster API’s controllers that they are healthy. These two pieces together allowed us to run scaling tests and reach our target of 1000 single node clusters. In this final part of the blog post series, we will take a look at the results, the issues that we encountered and the improvements that have been made.
Issues encountered and lessons learned
As part of this work we have learned a lot. We found genuine bugs and performance issues, but we also learned about relevant configuration options for Cluster API and controllers in general.
One of the first things we hit was this bug in Bare Metal Operator that caused endless requeues for some deleted objects. It was not a big deal, barely noticeable, at small scale. However, at larger scales things like this become a problem. The logs become unreadable as they are filled with “spam” from requeuing deleted objects and the controller is wasting resources trying to reconcile them.
As mentioned, we also learned a lot from this experiment. For example, that all the controllers have flags for setting their concurrency, i.e. how many objects they reconcile in parallel. The default is 10, which works well in most cases, but for larger scales it may be necessary to tune this in order to speed up the reconciliation process.
The next thing we hit was rate limits! Both client-go and controller-runtime have default rate limits of 10 and 20 QPS (Queries Per Second) respectively that the controllers inherit unless overridden. In general, this is a good thing, as it prevents controllers from overloading the API server. They obviously become an issue once you scale far enough though. For us that happened when we got to 600 clusters.
Why 600? The number was actually a good clue, and the reason we managed figure out what was wrong! Let’s break it down. By default, the Cluster API controller will reconcile objects every 10 minutes (=600 seconds) in addition to reacting to events. Each reconciliation will normally involve one or more API calls, so at 600 clusters, we would have at least one API call per second just from the periodic sync. In other words, the controllers would at this point use up a large part of their budget on periodic reconciliation and quickly reach their limit when adding reactions to events, such as the creation of a new cluster.
At the time, these rate limits were not configurable in the Cluster API controllers, so we had to patch the controllers to increase the limits. We have since then added flags to the controllers to make this configurable. If you found this interesting, you can read more about it in this issue.
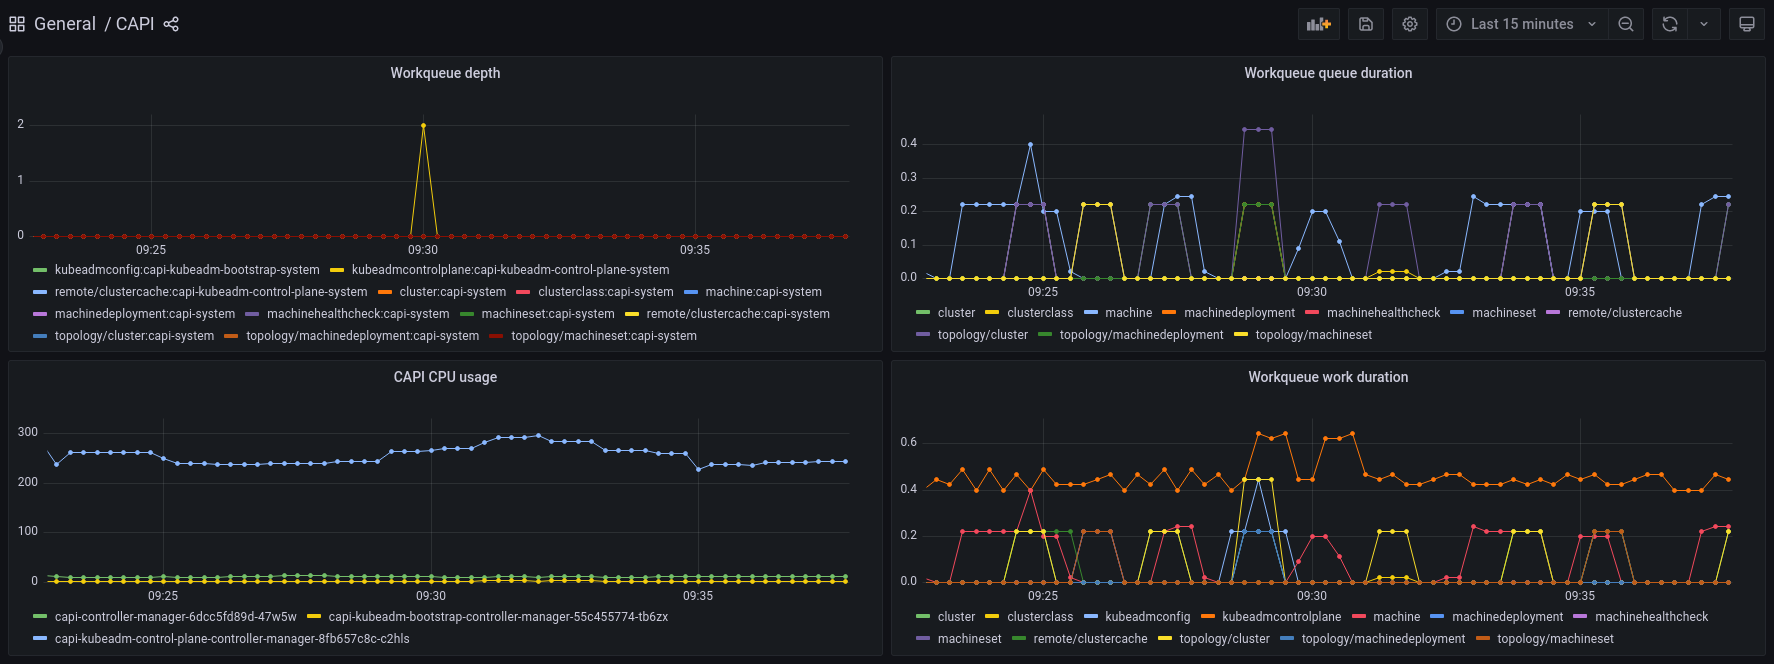
With concurrency and rate limits taken care of, we managed to reach our target of 1000 clusters in reasonable time. However, there was still a problem with resource usage. The Kubeadm control plane controller was unreasonably CPU hungry!
Luckily, Cluster API has excellent debugging and monitoring tools available so it was easy to collect data and profile the controllers. A quick look at the dashboard confirmed that the Kubeadm control plane controller was indeed the culprit, with a CPU usage far higher than the other controllers.
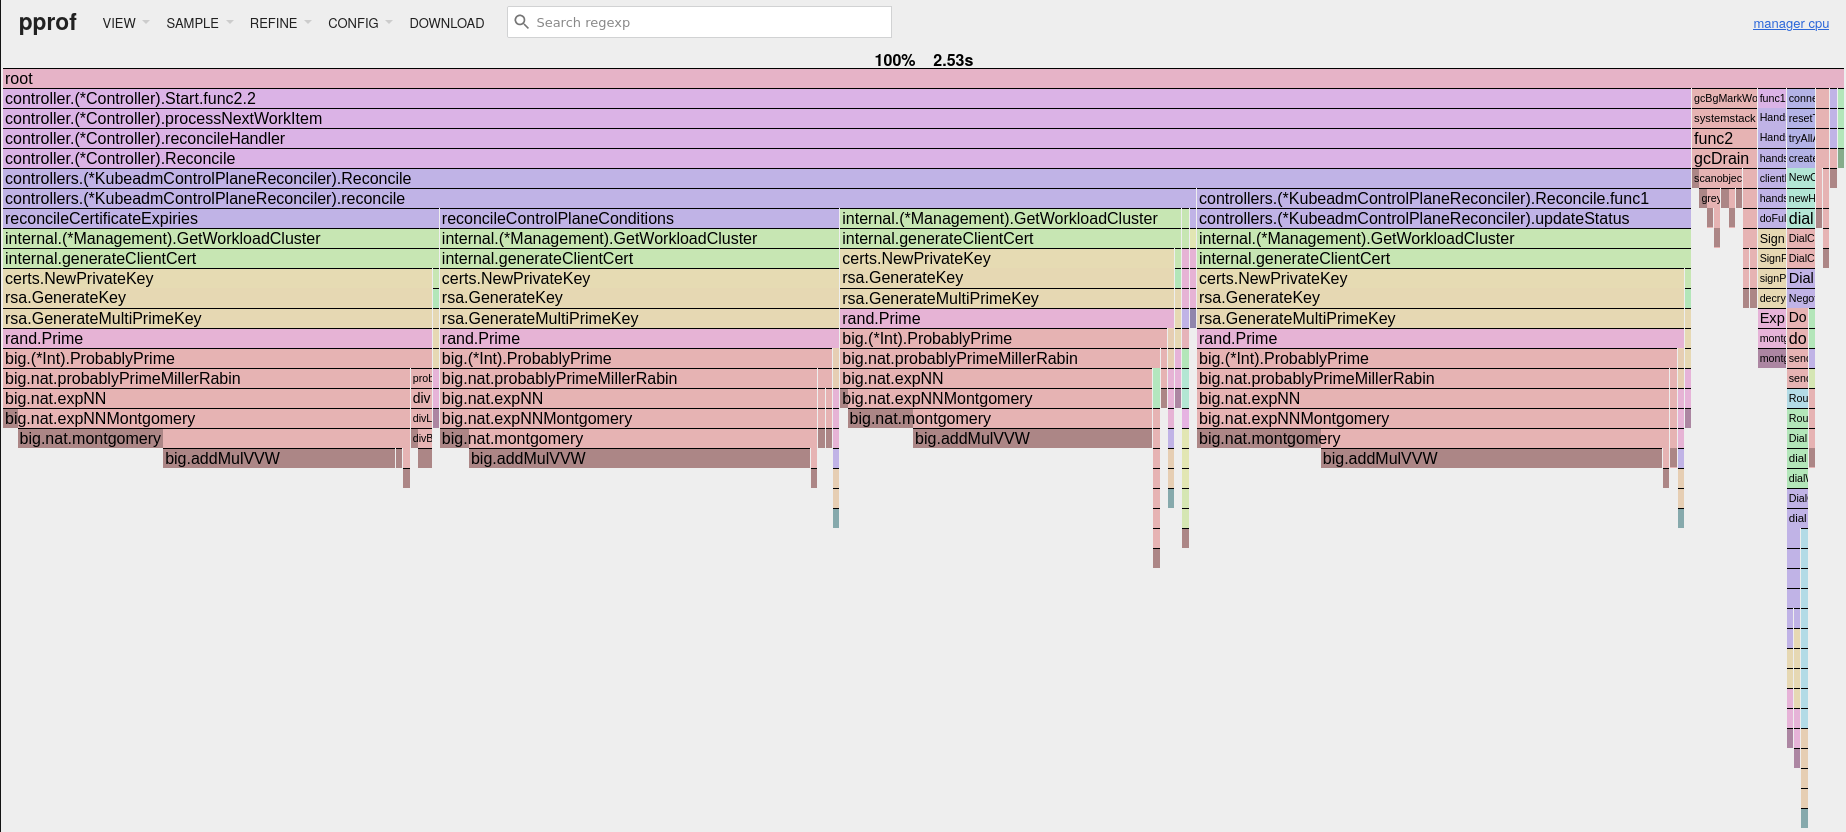
We then collected some profiling data and found the cause of the CPU usage. It was generating new private keys for accessing the workload cluster API server every time it needed to access it. This is a CPU intensive operation, and it happened four times per reconciliation! The flame graph seen below clearly shows the four key generation operations, and makes it obvious that this is what takes up most of the time spent on the CPU for the controller.
Improvements
All issues mentioned in the previous section have been addressed. The Bare Metal Operator is no longer re-queuing deleted objects. All controllers have flags for setting their concurrency and rate limits, and the Kubeadm control plane controller is now caching and reusing the private keys instead of generating new ones every time.
The impact of all of this is that
- the Bare Metal Operator has more readable logs and lower CPU usage,
- users can configure rate limits for all Cluster API and Metal3 controllers if necessary, and
- the Kubeadm control plane controller has a much lower CPU usage and faster reconciliation times.
Results
When we set out, it was simply not possible to reach a scale of 1000 clusters in a reasonable time. With the collaboration, help from maintainers and other community members, we managed to reach our target. It is now possible to manage thousands of workload clusters through a single Cluster API management cluster.
The discussions and efforts also resulted in a deep dive presentation at KubeCon NA 2023 from the Cluster API maintainers.
Cluster API itself now also has an in-memory provider which makes it almost trivial to test large scale scenarios. However, it must be noted that it can only be used to test the core, bootstrap and control plane providers. If you want to try it out, you can use the following script. Please note that this will still be CPU intensive, despite the improvements mentioned above. Creating 1000 clusters is no small task!
kind create cluster
export CLUSTER_TOPOLOGY=true
clusterctl init --core=cluster-api:v1.7.2 --bootstrap=kubeadm:v1.7.2 --control-plane=kubeadm:v1.7.2 --infrastructure=in-memory:v1.7.2

# Patch the controllers to increase the rate limits and concurrency
kubectl -n capi-system patch deployment capi-controller-manager \
  --type=json -p='[
    {"op": "add", "path": "/spec/template/spec/containers/0/args/-", "value": "--kube-api-qps=100"},
    {"op": "add", "path": "/spec/template/spec/containers/0/args/-", "value": "--kube-api-burst=200"},
    {"op": "add", "path": "/spec/template/spec/containers/0/args/-", "value": "--cluster-concurrency=100"},
    {"op": "add", "path": "/spec/template/spec/containers/0/args/-", "value": "--machine-concurrency=100"}
  ]'

kubectl -n capi-kubeadm-control-plane-system patch deployment capi-kubeadm-control-plane-controller-manager \
  --type=json -p='[
    {"op": "add", "path": "/spec/template/spec/containers/0/args/-", "value": "--kube-api-qps=100"},
    {"op": "add", "path": "/spec/template/spec/containers/0/args/-", "value": "--kube-api-burst=200"},
    {"op": "add", "path": "/spec/template/spec/containers/0/args/-", "value": "--kubeadmcontrolplane-concurrency=100"}
  ]'

kubectl -n capi-kubeadm-bootstrap-system patch deployment capi-kubeadm-bootstrap-controller-manager \
  --type=json -p='[
    {"op": "add", "path": "/spec/template/spec/containers/0/args/-", "value": "--kube-api-qps=100"},
    {"op": "add", "path": "/spec/template/spec/containers/0/args/-", "value": "--kube-api-burst=200"},
    {"op": "add", "path": "/spec/template/spec/containers/0/args/-", "value": "--kubeadmconfig-concurrency=100"},
    {"op": "add", "path": "/spec/template/spec/containers/0/args/-", "value": "--cluster-concurrency=100"}
  ]'

# Create a ClusterClass and save a Cluster manifest
kubectl apply -f https://github.com/kubernetes-sigs/cluster-api/releases/download/v1.7.2/clusterclass-in-memory-quick-start.yaml
clusterctl generate cluster in-memory-test --flavor=in-memory-development --kubernetes-version=v1.30.0 > in-memory-cluster.yaml

# Create 1000 clusters
START=0
NUM=1000
for ((i=START; i<NUM; i++))
do
  name="test-$(printf "%03d\n" "$i")"
  sed "s/in-memory-test/${name}/g" in-memory-cluster.yaml | kubectl apply -f -
done
This should result in 1000 ready in-memory clusters (and a pretty hot laptop if you run it locally). On a laptop with an i9-12900H CPU, it took about 15 minutes until all clusters were ready.
Conclusion and next steps
We are very happy with the results we achieved. The community has been very helpful and responsive, and we are very grateful for all the help we received. Going forward, we will hopefully be able to run scale tests periodically to ensure that we are not regressing. Even small scale tests can be enough to detect performance regressions as long as we keep track of the performance metrics. This is something we hope to incorporate into the CI system in the future.